
BEBPA Blog
Volume 2, Issue 4
Robust Regression: An Effective Tool for Detecting Outliers in Dose-Response Curves
By Sonja Klingelhöfer, PhD, Principal Scientist, Richter BioLogics
Introduction
Outliers are abnormal values in a data set and are described as “inconsistent with the known or assumed data distribution” [1]. In potency testing, outliers can occur at two levels: either as an extreme relative potency (RP) result in the reportable value or in the assay data set (such as a replicate value in a dose-response curve), see examples in Table 1 and Figure 1, respectively.
Table 1 shows an example of an extreme RP result in a data set of three assays (1, 2 and 3), which are combined to produce a reportable value by calculating the geometric mean (GMN) and geometric coefficient of variation (GCV). Results of this kind are usually investigated using an OOE (out-of-expectation) procedure if the acceptance criterion for variability in the reportable value is not met (≤15% in this example). Repeated analysis (assays R1, R2 and R3 in Table 1) was carried out during the investigation, and the results of the repetition were reported in the example. This example illustrates how an outlier test can be a useful tool when investigating the root cause of an issue when the reason cannot be identified. In this example, using all six assay results for a Grubbs statistical outlier test identified the RP value of assay 2 as an outlier (unlike the analysis of the initial three assays alone).
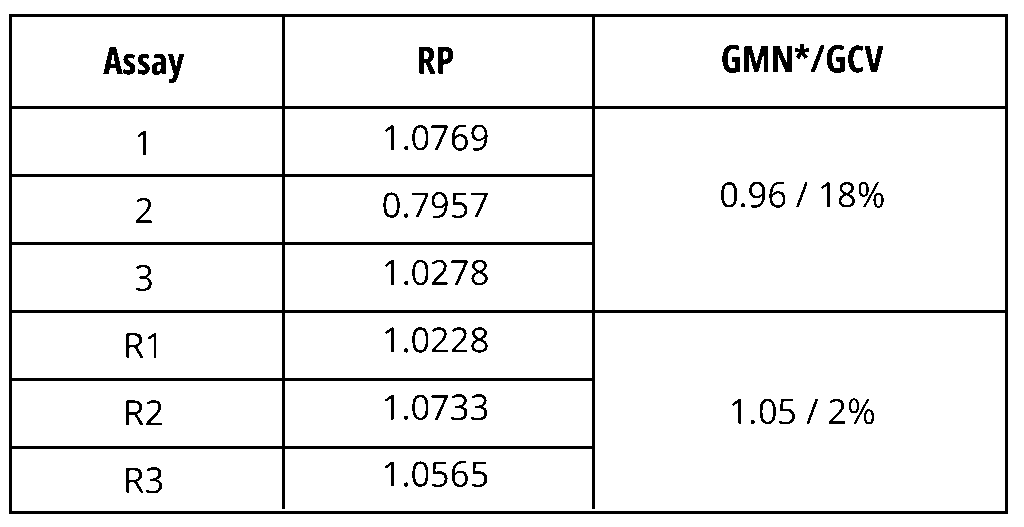
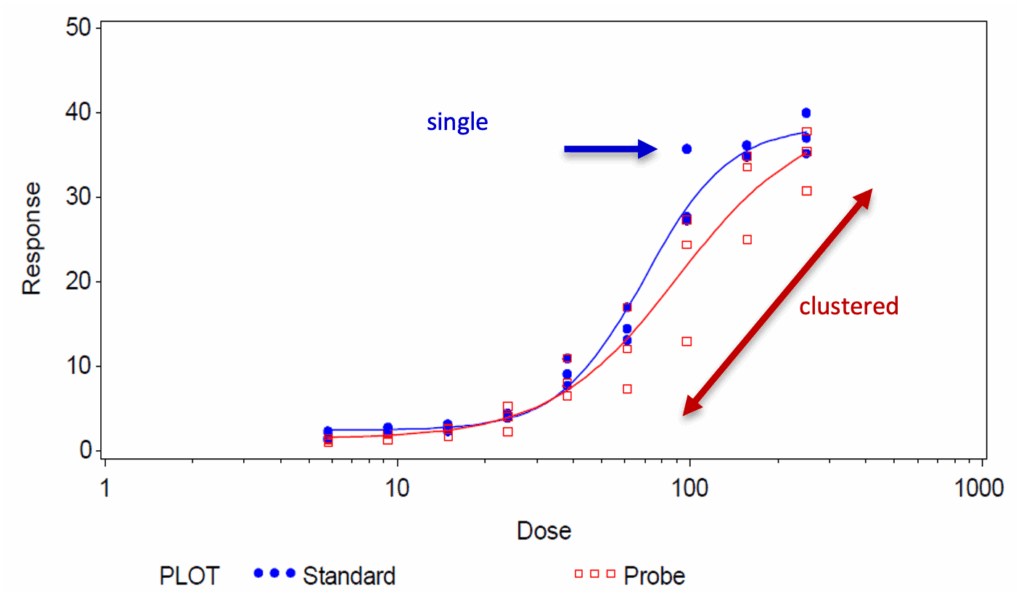
Figure 1 shows an example of bioassay data with different types of variability in the data set. In the standard data set, only one data point (at a dose of 100) is far from the dose-response curve and could be identified as an outlier through statistical testing. In the sample data set, this is true for at least four points derived from the serial dilution of one replicate. In both cases, the extreme values affect the dose-response curve and consequently, the calculation of the final RP result, but to a different extent.
This article focuses on abnormal values in bioassay data sets following a non-linear regression see Figure 1 for an example. Due to the complexity and inherent variability of a biological assay, extreme values – potential outliers – are not uncommon. Unfortunately, the regression model used to calculate relative potency from assay data (4-parameter fit equation using least-squares regression) can be quite sensitive to outliers [2, 3]. It is for this reason that the USP suggests that “bioassay data should be screened for outliers before relative potency analysis” [4].
In general, there are two types of outlier tests: Replicate-based and model-based. For bioassay data sets, the number of replicates is limited (e.g. triplicates are often used) and therefore replicate-based tests like Grubbs or Dixon have their limitations (see below). The general principles of outlier testing for potency assays have already been described by Perceval Sondag [5]. This article provides an overview of the different types of statistical outliers (single vs. clustered observations) and the consequences that unidentified outliers can have. It also compares different outlier tests based on an extensive simulation study and concludes that the model-based ROUT (Robust Outlier detection Test) method is the most suitable outlier test for non-linear regression models tested. Model-based approaches for outlier testing are also mentioned in the bioassay chapters of USP and Ph. Eur. [2, 4], but concrete guidance is lacking. At present, the ROUT method is only readily available in the GraphPad PRISM software and is not available in any validated software system commonly used in Quality Control laboratories in the biopharmaceutical industry.
Most publications on outlier testing are based on simulated data sets that assume normally distributed data [5, 6, 7]. However, this blog article will discuss the topic from a practical Bioassayists’ point of view.
The first challenge in outlier testing of bioassay data is that most of the tests are based on general assumptions such as normal-distribution, independence of data and homogeneity of variances. Considering the design structure of a bioassay, the commonly used serial pipetting and other practical constraints for execution in the lab, these statistical assumptions cannot be strictly met. Accordingly, tests will produce different outlier identification results depending on the test method. A second challenge for outlier testing in bioassays is the variety of assay designs and formats, including different levels of variability and replication strategies. Therefore, an outlier identification strategy should be defined on a case-by-case basis and justified by historical data (ideally from a validation study). A third challenge is that the assay variability which is the basis for statistical outlier testing can vary from assay to assay. Therefore, statistical outlier elimination should be used carefully and only in justified cases (as described below in a two-tiered approach), e.g. to avoid increasing false positives in assays with low variability. Furthermore, the maximum number of outliers allowed to be removed (per assay, run, treatment and dose) should be defined as suitability criterion. The outlier detection rate should be monitored, and action taken if it is higher than expected [4].
Detection of Outliers in Dose-Response Curves
From a practical point of view, replicate-based outlier tests rarely work or have its limitations regarding bioassay data sets. In most cases they are not sensitive enough, due to the limited number of replicates In addition, they are often unable to identify more than individual outliers (e.g. Grubbs test). In contrast, model-based outlier tests such as ROUT [6] use the replicate data from all concentrations of a treatment. However, the test has its limitations when systematic or block effects occur, requiring additional rules and techniques. When the variability of the whole data set is increased, it is particularly important to distinguish between random error and systematic effects, as the latter can extremely bias the RP result.
Since outliers in bioassay data sets stem from unforeseen sources of variation, such as pipetting errors, other procedural errors, or material variability, investigation of the cause of the outlier should be the first step [4, 8]. If a data point can be clearly identified as a technical outlier, a simplified outlier removal procedure may be used. Due to the complexity of bioassays, it is not always possible to find a retrospective root cause. In this case statistical testing (combined with pre-defined rules) is very useful to avoid biasing the RP result by an unidentified outlier. Statistical outlier testing is performed using the unconstrained model (see example in Figure 2) and prior to checking for system and sample suitability criteria.
According to the USP, the removal of observations based on statistical considerations alone should be used rarely. Therefore, a two-tiered approach to outlier identification is recommended to define objective rules that are suitable for each data set and to reduce the risk of over-identification of outliers in assays with low raw data variability. This approach is in accordance with USP, which describes visual “outlier labeling” using graphical techniques as an informal recognition of outlying results [1]. Such graphical techniques used for visual “outlier labeling” are residual plots (raw or studentized residuals), box and whisker plots and normal probability plots.
Figure 2 shows an example of a bioassay set with an extreme value of unknown reason that effects the shape of the standard dose-response curve as well as the RP result. In addition to the evaluation of the CV of the replicates, a graphical evaluation using the studentized residual and normal probability plot is used to check whether further statistical outlier testing is indicated, see Figure 3. Based on this visual assessment and confirmation that the extreme value in the example is indeed abnormal, further statistical outlier testing is indicated in the example using the ROUT method described by Motulsky & Brown [6]. The data set is then re-evaluated using robust regression with an iterative reweighted least squares (IRLS) technique and the calculation of robust residuals [6]. (Because it makes fewer assumptions, this model and the robust residuals are less affected by potential outliers than the model and residuals from the least squares fit). By defining the false discovery rate (FDR), the sensitivity of the test can be adjusted on a case-by-case basis [6]. In the present case, the FDR for the outlier test was set at 0.1 (corresponding to limits for the studentized residuals of -4 / 4) based on the evaluation of historical data as well as simulations. The extreme value in this example was identified as an outlier and removed from the data set, see Figure 4. Compared to this, the Grubbs test failed to identify the extreme value as an outlier. And the persisting outlier in the data set would have compromised the similarity assessment and biased the RP result by 9 % (the RP value is 1.19 and 1.09 before and after outlier elimination, respectively). The graphical re-evaluation of the different plots further supports the correctness of the outlier removal in the present example (Figures 4 and 5).
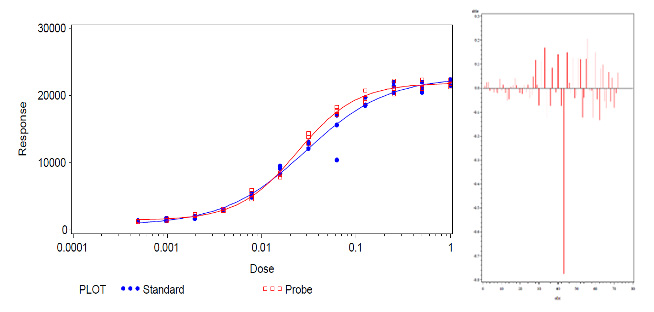
Figure 2: Left: Exemplary bioassay data (data fitted by least-squares regression) with one extreme in the standard treatment, influencing the shape of the dose-response curve. Right: Plot of the local influence values confirming the effect of the extreme value in the standard treatment on the shape of the dose-response curve. (Note: The influence values are scale-dependent and one aberrant value can only be interpreted in comparison to the others).
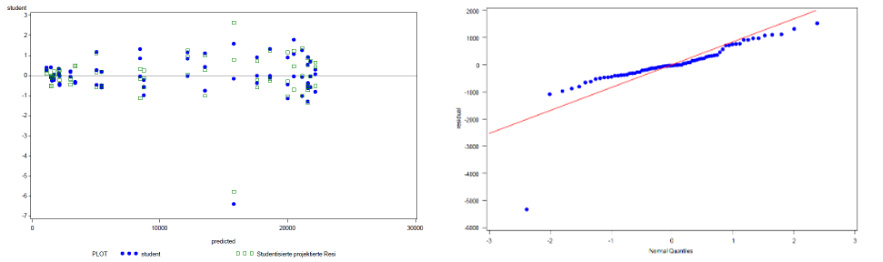
Figure 3: Additional graphical evaluation of the example bioassay data from Figure 1 using a studentized residual plot (left) and a normal probability plot (right), confirms that the extreme value is inconsistent with the rest of the data set (left: studentized residuals near to 6; right: single value far away from diagonal).
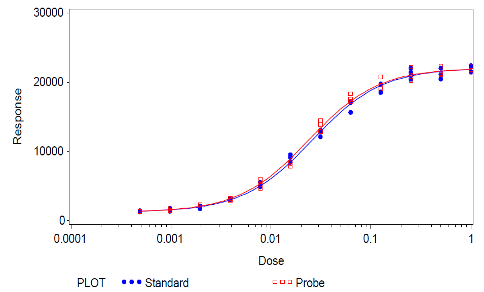
Figure 4: Example bioassay data (from Figure 1) after removal of the outlying data point, showing improved similarity of dose-response-curves from standard and sample (probe).
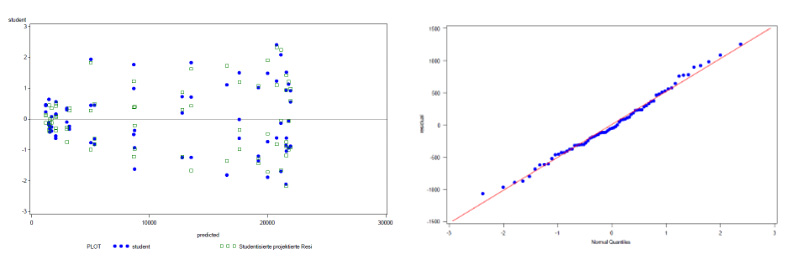
Figure 5: Additional graphical evaluation of the exemplary bioassay data (from Figure 3, after removal of the outlying data point) using a studentized residual plot (left) and a normal probability plot (right), confirming nearly constant variance and normal distribution in the final data set.
What Are the key advantages of the ROUT Method?
Based on the experience gained from testing of bioassay data sets with different layouts and designs, the ROUT method has shown that it is not only a good theoretical basis for an outlier detection strategy, but also works in practice with normal replication strategies (typically triplicates or quadruplicates). And the method appears to be robust to minor departures from statistical assumptions such as normality, independence and constant variance, although normality is an important assumption made in the identification of outliers by robust regression. However, in the case of heterogeneous variances, the ROUT method can also be used in combination with weighting (if no optimal transformation of the data can be found).
Another advantage of the ROUT method is, that the sensitivity of the test can be adjusted. Based on the assumption of normally distributed residuals, the default FDR setting in the ROUT is 1 (corresponding to residual values greater than 3 / lower than -3 that can be considered outliers). However, historical data and / or simulation studies should be used to test and confirm the optimum FDR setting on a case-by-case basis. And despite the frequency of statistically identified outliers, the impact on the final RP result should be also considered to protect against a high rate of false positives.
The example above shows that a reliable outlier identification procedure leads to improved bioassay method performance in terms of the risk of skewed dose-response curves, compromised parallelism, and biased RP estimation. The ROUT method is capable of detecting more than one outlier in a data set, but when block effects occur, additional rules or acceptance criteria are required. Block effects are not in the focus of this article but can be analyzed in a similar way to the plate-to-plate effects discussed by Williams et al. [9].
Conclusion
More than other assays, potency assays are subject to outliers. And the application of a sound outlier testing practice should be a key aspect of statistical bioassay evaluation [1, 2, 4, 8]. Due to the sensitivity of the least-squares regression model to outliers, even a single outlier can significantly skew the regression curve, leading to false conclusions about the model or the accuracy of the final RP result, or both. In addition to the statistical concept, also from a practical point of view, the ROUT method is a very useful, flexible and robust method that can be used for statistical outlier testing in bioassays.
Statistical Software
Functions for robust regression are available in statistical packages like SAS (SAS Institute) [10, 11]. The presented analyses were carried out using customized routines programmed by Denise Welsch (University of Applied Sciences Koblenz) in SAS.
References:
[1] US Pharmacopeial Convention (2021). USP< 1010> Analytical Data – Interpretation and Treatment.
[2] European Pharmacopoeia (2005). Chapter 5.3. Statistical analysis of results of biological assays and tests.
[3] Steven Walfish (2006). A Review of Statistical Outlier Methods. Pharmaceutical Technology 30, Issue 11.
[4] US Pharmacopeial Convention (2013). USP< 1032> Design and Development of Biological Assays.
[5] Perceval Sondag, Outliers in Dose-Response Curves: What Are They, and What Can We Do About It? BEBPA: Volume 1, Issue 6.
[6] Motulsky, H. J., & Brown, R. E. (2006). Detecting outliers when fitting data with nonlinear regression–a new method based on robust nonlinear regression and the false discovery rate. BMC Bioinformatics, 7, 123.
[7] Ann Yellowlees et al. (2016). The Appropriateness of Robust Regression in Addressing Outliers in an Anthrax Vaccine Potency Test. BioScience 66, No. 1, pp. 63-72.
[8] US Pharmacopeial Convention (2020). USP<111> Design and Analysis of Biological Assays.
[9] James D. Williams et al. (2003), A Statistical Method to Account for Plate-to-Plate Variability in Multiple-Plate Bioassays, BioPharm International.
[10] SAS/STAT 9.3 User’s Guide, The NLIN Procedure.
[11] Colin Chen: Robust Regression and Outlier Detection with the ROBUSTREG Procedure Paper 265-27, SAS Institute Inc, Cary, NC.


About The Author: Sonja Klingelhöfer, PhD
Dr. Sonja Klingelhöfer is currently working as a principal scientist at Richter BioLogics – a CDMO specializing in microbial production. Bioassays have been her passion for the last 28 years, starting with the development of assay for drug screening. She then set up a GMP laboratory specializing in biological assays for a variety of biopharmaceutical products (recombinant proteins, plasmid DNA and vaccines) at Richter BioLogics, and managed the department for over 20 years. Sonja holds a Diploma in Biology from the Philipps University of Marburg, and a Ph.D. in Biology from the University of Kiel, Germany. Before joining the pharmaceutical industry, she worked as a scientist in a Max-Planck group at DESY in Hamburg.