BEBPA Blog
Volume 1, Issue 6
Outliers in Dose-Response Curves: What Are They, and What Can We Do About It?
By Perceval Sondag, PhD, Board Member, BEBPA
Introduction
Potency assays are designed to gauge the biological activity or binding affinity of a test sample in relation to a reference preparation (USP 1032; Vølund, 1978). For instance, in the production of a biotherapeutic or vaccine, the potency of material from a new batch can be calibrated in comparison to that of a reference batch material. The concept of relative potency (RP) is derived from the concentration-response functions of the two products. When the test product behaves as a dilution or concentration of the reference product, the two products exhibit a consistent RP. Graphically, concentration-response curves reflecting constant RP differ only through a shift along the log-concentration axis. It is crucial to note that calibration based on a consistent RP value can only be carried out when the concentration-response functions of the two products are deemed statistically similar or parallel (Finney, 1964; Bortolotto et al., 2015).
Like any laboratory experiment, potency assays are subject to outliers.
The US National Institute of Science and Technology defines a statistical outlier as “an observation that lies an abnormal distance from other values in a random sample from a population.”
In real-world scenarios, outliers in bioassays stem from unforeseen sources of variation, such as pipetting errors, dilution inaccuracies (Yang et al., 2012), incorrect incubation times, procedural errors, material variability, or differences in experimental techniques, amongst others (Fleetwood et al., 2012). When statistical outliers persist within the dataset without corrective action, the assessment of similarity may be compromised, leading to potential bias in estimating the RP value.
Before digging further, we must define the two main families of statistical outliers one may encounter:
- An abnormal RP value, as compared to other measured RPs in a dataset. This is most commonly seen in an out-of-specification (OOS) situation. Where the first run results in a n out of specification as either ahigh or low reportable value. However additional runs, which are part of the mandated OOS procedure only return within specification results. Such an example might be 55, 85, 105 and 98. In this case the first reportable value 55 might be an outlier.
- An abnormal observation (or group of observations) in the dose-response curves that are used to estimate the RPs.
The large majority of publications on outliers focus on the first family, and just about all the detection tests proposed in the Bioassay literature do as well. In this work, we take a deeper look at the second family, and focus on outliers in dose-response curves.
Another definition for a statistical outliers could be “observations that kind of mess up everything so we would like them not to exist anymore, but we can’t get rid of them unless a formal test says so.” Of course, this definition will not pass a peer-reviewed process, but it triggers the question: should we get rid of them? When statistical outliers are present in the dose-response curve, the test of similarity may be compromised and/or the RP value may be estimated with bias. The United States Pharmacopeia (USP) <1032> advises the screening of bioassay data to identify outliers prior to undertaking RP analysis. As highlighted by Schofield (2016), certain laboratories may opt to exclude individual outliers, while others may exclude particular dilutions linked with the outliers. It is crucial for the laboratory to thoroughly assess the ramifications of excluding outliers on the processes of similarity testing and the determination of relative potency.
In this work, we summarize two scientific papers written on the topic:
- Sondag, P., Zeng, L., Yu, B., Rousseau, R., Boulanger, B., Yang, H., & Novick, S. (2018). Effect of a statistical outlier in potency bioassays. Pharmaceutical statistics, 17(6), 701-709.
- Sondag, P., Zeng, L., Yu, B., Yang, H., & Novick, S. (2020). Comparisons of outlier tests for potency bioassays. Pharmaceutical statistics, 19(3), 230-242.
Effect Of An Outlier
Both papers use the common parametrization of the four-parameter logistic dose-response function proposed by Rodbard and Hutt (1974):

Where
- yMax = upper asymptote
- H = curve steepness
- = Inflection point
- yMin = lower asymptote
Let’s consider 3 types of statistical outliers for dose-response curves:
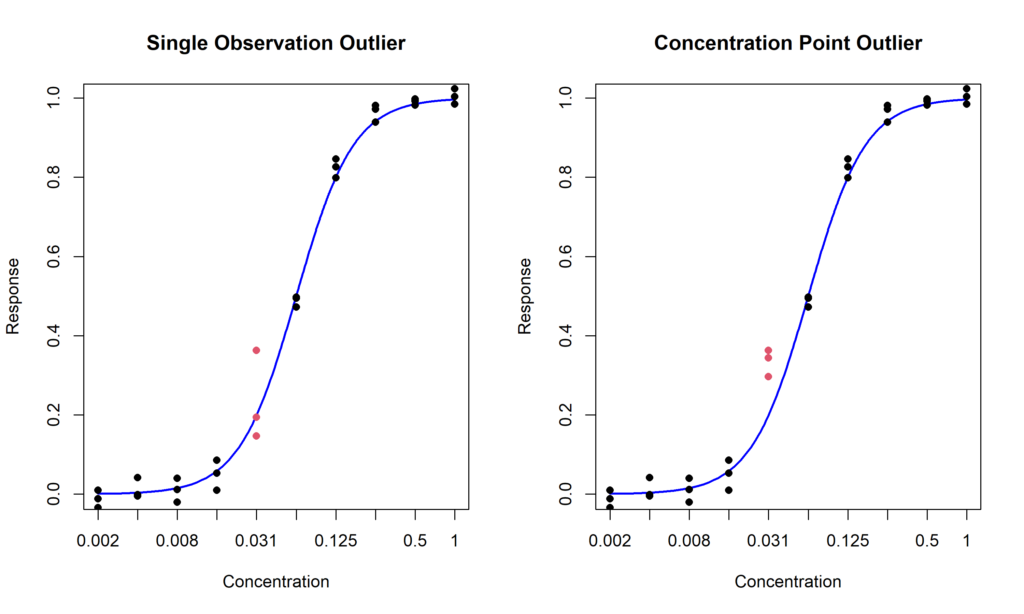
- Single observation outlier: a single measurement is excessively distant from the other values (Figure 1, left);
- Concentration point outlier: all the replicates at one concentration level are unexpectedly different than the values at the other concentration points (Figure 1, right)
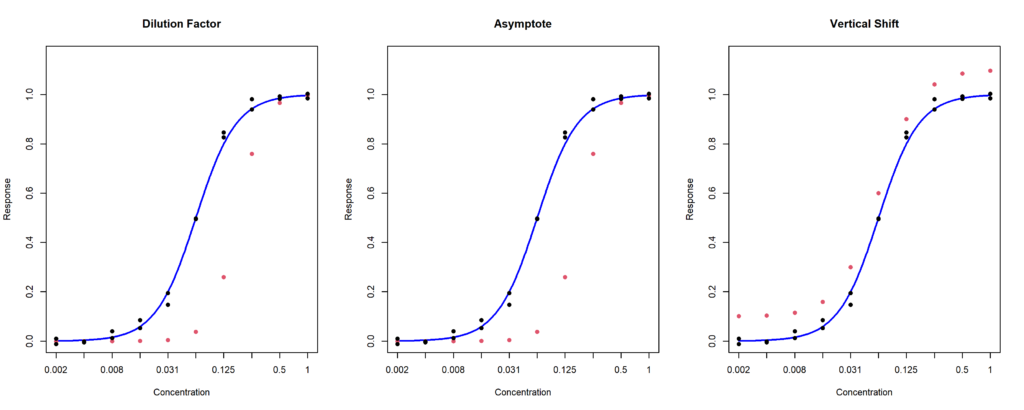
- Whole curve outlier: one of the curve replicates is abnormal. It can affect the dilution factor (Figure 2, left), one of the asymptotes (Figure 2, middle), or both asymptotes, inducing a vertical shift (Figure 3.2, right).


Using an extensive simulation study, the first paper aims to quantify the actual effect of an outlier on the results of a potency assay. The results indicate that:
- Outliers in the asymptotes area do not generally generate an important bias in the relative potency estimation but increase the chances of failing the similarity test. In other words, outliers in the asymptote area increase the risk to reject a good assay.
- Outliers in the center of the curve do not generally affect the results of the similarity test. However, they can lead to a large bias in the relative potency estimation. In other words, outliers in the center of the curve increase the risk to accept a bad assay.
- Whole curve outliers also increase the chances of failing the similarity tests, but the curves that will still pass the test will have a very large bias in relative potency estimation. In other words, whole curve outliers mess everything up!
Testing For Outliers
Now that we have established that screening for statistical outliers prior to testing similarity and estimating the relative potency, the remaining question is: how? There are so many tests available, and it is quite difficult to know which to use.
USP <1010> sets forth three distinct tests for identifying outliers within bioassay data. The first, Generalized Dixon’s Q test for outliers, involves testing whether the point that is furthest away from the remaining data is significantly different from the others (Dixon, 1953). The second test, Generalized Extreme Studentized Residual (ESD), entails the process of ‘studentizing’ each value (subtracting the mean and dividing by the standard deviation) and subsequently comparing it to a critical value (Rosner, 1975). Finally, USP <1010> introduces Hampel’s rule, where each value is ‘normalized’ (subtracted by the median and divided by the median absolute deviation) and subsequently compared to the value 3.5.
These three tests pose immediate problems:
- Dixon’s tests only tests for one outlier at a time and is not built to detect multiple outliers. A possible solution is to run the test iteratively. That is, is an outlier is detected, it can be excluded from the dataset prior to run the test again on the remaining observations.
- The threshold value of 3.5 for Hampel’s test is arbitrary. While this value is allegedly a practical compromise based on empirical observations, as far as I am aware of, no statistical justification exists for this number.
- None of these tests apply to whole-curve outliers. In practice, tests for single observations may be applied such that if several outliers are found within the same replicate, that replicate might be an outlier.
Outside of USP <1010>, Motulsky and Brown (2006) proposed the Robust OUTlier detection test (ROUT), which fits a 4PL model on the data assuming that the residuals follow a Cauchy distribution, rather than the common assumption of Normally distributed error.
These tests were compared in an extensive simulation study. For single observation and concentration point outliers, ROUT overwhelmingly outperformed the three tests suggested by USP <1010>. While it came at the cost of a higher false detection rate, the impact of removing incorrectly flagged observations had a minimal impact on similarity testing and RP estimation. Therefore, we concluded that ROUT was the best-known outlier detection method for dose-response curve.
For whole-curve outliers, there is a lack of efficient tests available. In the paper, we assessed two tests:
- Applying ROUT to all the data and, if 3 or more outliers are detected within the same curve, that curve is declared an outlier (ROUT3);
- A Maximum Departure Test (MDT), developed in the original paper.
While MDT generally outperformed the ROUT3 method, both tests performed poorly for high-variability assays, due to the fact that the full-replicate shift may get lost in the overall noise in the data.
Discussion
Two common questions statisticians ask when talking about outliers with lab-scientists are: “Do you investigate the cause of an outlier before removing it?” and “If outliers are so common in bioassays, are they really outliers?”.
The answer to the first question is usually that outliers happen too often to investigate all of them. Which actually leads to the second question. Based on the observations from both papers, I agree with the USP recommendations to screen for outliers and heavily suggest deleting all detected outliers regardless of the risk for false positives.
The misconception that outliers will be rare stems from the fact that, they are not true outliers but rather values that are 3+ standard deviation away from the mean, in a Normal distribution, they should indeed be rare. If they are not, either your distribution is not Normal, or something wrong happened. For example, if your data at a single concentration point look like Figure 3, the observed sample most likely does not originate from a Normal distribution and the data should either be transformed, or alternative solutions need to be evaluated with the help of a statistician.

References
- US Pharmacopeial Convention. (2012). USP< 1032> design and development of biological assays.
- VØlund, A. (1978). Application of the four-parameter logistic model to bioassay: comparison with slope ratio and parallel line models. Biometrics, 357-365.
- Finney, D. J. (1964). Statistical method in biological assay. Statistical method in biological assay., (2nd edn).
- Bortolotto, E., Rousseau, R., Teodorescu, B., Wielant, A., & Debauve, G. (2015). Assessing similarity with parallel-line and parallel-curve models. Bioprocess Int, 13, 26-37.
- Yang, H., & Zhang, L. (2012). Evaluations of parallelism testing methods using ROC analysis. Statistics in Biopharmaceutical Research, 4(2), 162-173.
- Fleetwood K. (2012). Accounting for variability in relative potency estimates. BEBPA’s 5th Annual Biological Assay Conference. Lisbone.
- Schofield, T. (2016). Lifecycle approach to bioassay. Nonclinical statistics for pharmaceutical and biotechnology industries, 433-460.
- Sondag, P., Zeng, L., Yu, B., Rousseau, R., Boulanger, B., Yang, H., & Novick, S. (2018). Effect of a statistical outlier in potency bioassays. Pharmaceutical statistics, 17(6), 701-709.
- Sondag, P., Zeng, L., Yu, B., Yang, H., & Novick, S. (2020). Comparisons of outlier tests for potency bioassays. Pharmaceutical statistics, 19(3), 230-242.
- Dixon, W. J. (1953). Processing data for outliers. Biometrics, 9(1), 74-89.
- Rosner, B. (1975). On the detection of many outliers. Technometrics, 17(2), 221-227.
- Hampel, F. R. (1985). The breakdown points of the mean combined with some rejection rules. Technometrics, 27(2), 95-107.
- US Pharmacopeial Convention. (2012). USP< 1010> analytical data interpretation and treatment.
- Motulsky, H. J., & Brown, R. E. (2006). Detecting outliers when fitting data with nonlinear regression–a new method based on robust nonlinear regression and the false discovery rate. BMC bioinformatics, 7, 1-20.

About The Author: Perceval Sondag, PhD
Dr. Percy Sondag holds a Bachelor’s Degree in Physical Therapy and Master’s Degree in Biostatistics from the Catholic University of Louvain-la-Neuve, and a Ph.D. in Biomedical Sciences from the University of Liege. He is a Senior Director of Data Science at Novo Nordisk. He previously worked at Merck and Pharmalex (formerly Arlenda) as a Statistician. He specializes in Bayesian modelling and statistics applied to bioassays and process manufacturing. Since 2017, he is also a member of the Bioassay Expert Panel and the Statistics Expert Committee at the U.S. Pharmacopeia.
