
BEBPA Blog
Volume 2, Issue 9
Model-Based Similarity Criteria for Bioassay
By Steven Walfish, Principal CMC Statistician, Iovance Biotherapeutics
Introduction
The determination of similarity is based on a paper by Plikaytis, et al and standard covariant model. The idea is that a key condition for relative potency determination is the Test and Standard contain the same effective constituent, or the same effective constituents in fixed proportions, and all other constituents are without effect, i.e., the Test will behave as a dilution or concentration of the Standard. Similarity can be stated mathematically as Fₜ(z) = Fₛ(ρz), where ρ is the relative potency of Test to Standard and z is concentration.
Traditional Similarity
USP <1032> presents several approaches for implementing equivalence testing for similarity (parallelism). The typical statistical hypothesis testing for assessing similarity is based on a statistical null hypothesis consistent with similarity and an alternative hypothesis of some degree of non-similarity. Failure to reject the null hypothesis of similarity is then taken as a conclusion of similarity, though this is not true. Equivalence testing provides a method to proceed to a conclusion of sufficiently similar while controlling the risk of doing so inappropriately. The following is a summary of the sequence for this process:
- Choose a measure of non-similarity. For the four-parameter logistic model, similarity between Standard and Test samples must be assessed based on three parameters: the upper asymptote, the slope, and the lower asymptote.
- Specify a range of acceptable values, typically termed an equivalence interval or “indifference zone,” for the measure of non-similarity. When a ratio of slopes is used as a measure of non-similarity, that measure is free to vary above or below a ratio of 1.0 (a ratio of 1.0 indicates perfect similarity). The acceptable values for non-similarity then constitute an interval.
- An alternative to the approach is to use an average (historical) value for the variance of the ratio or difference in a similarity parameter—obtained from some number of individual assays—to compute an acceptance interval for a point estimate of the similarity parameter.
Application of Model-based Criteria in Bioassay Settings
Alternatively, similarity can be evaluated directly using the model that estimates relative potency. Under the similarity assumption, the test and reference curves in a parallel-line assay should have identical slopes. Therefore, the difference between the slopes can serve as a simple criterion for detecting non-similarity. In addition, for a parallel line assay, the relative potency is the difference in the intercepts divided by the common slope from a constrained model of equal slopes in the log scale. Under this model, a sample with a relative potency would have a difference of zero (log(0)=1). Another similarity criterion would be the difference in the intercepts from the same unconstrained model.
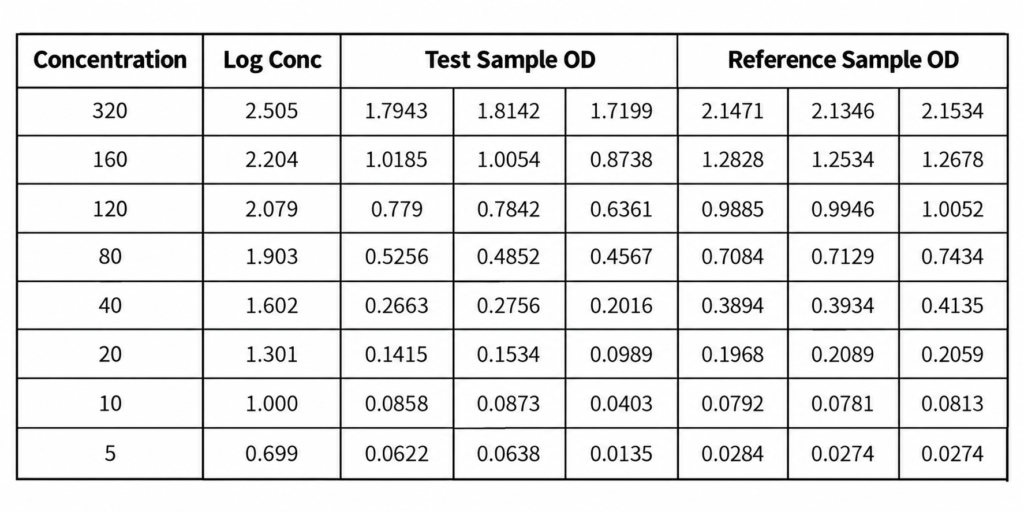
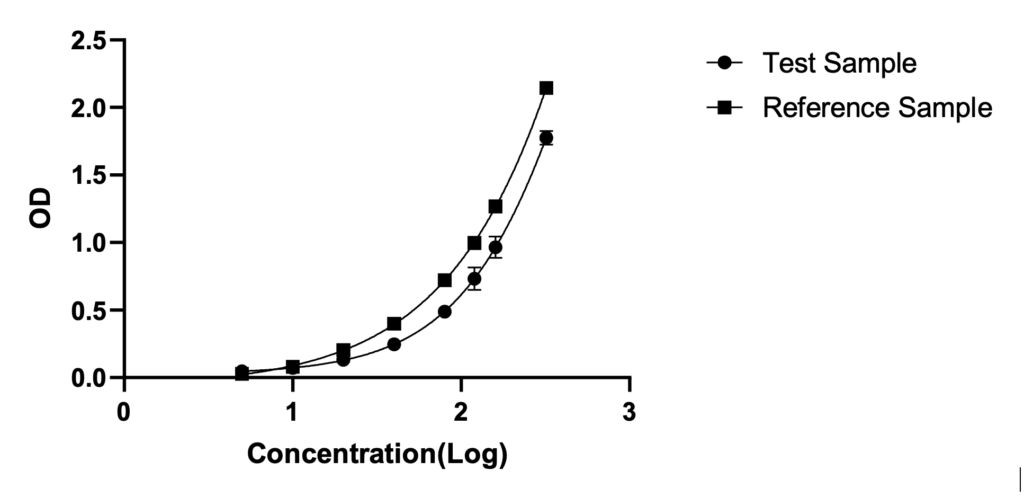
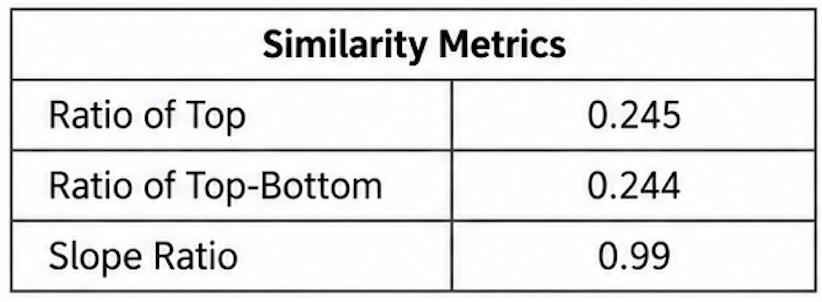
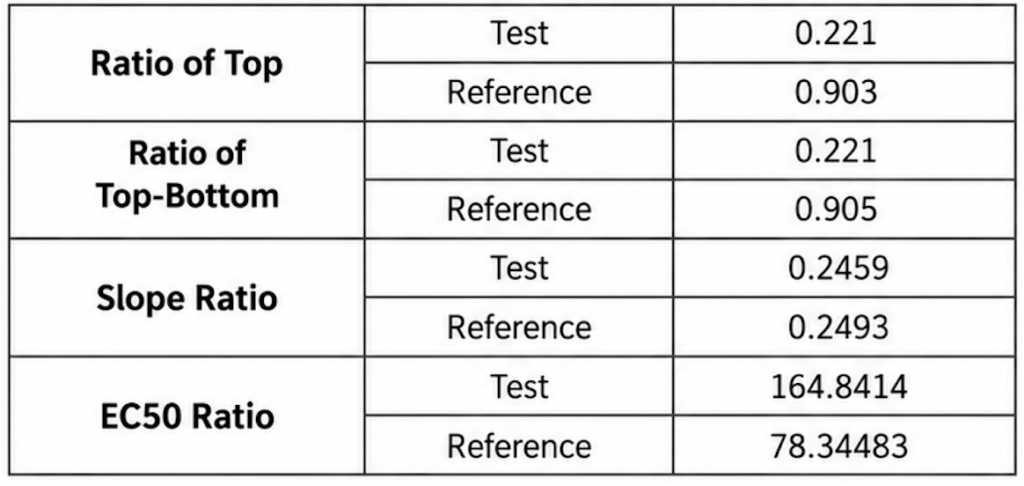
The non-linear four-parameter model does not provide simple parameters of slope and intercept leading to the use of ratios of model parameters of the unconstrained model. A comparison of model parameters between the constrained and unconstrained model can show if the assumption of similarity is confirmed. If the test and reference curves are parallel, then the EC50 for the unconstrained and constrained model should not differ. The ratio of the EC50 from the two models should be close to 1.
For all model based criteria, acceptance criteria need to be set based on a historical set of data. Most importantly these acceptance criteria should fail poor performing assays. A check of both the sensitivity and specificity of the acceptance criteria should be conducted.
Despite advantages, model-based similarity criteria face challenges including model misspecification, overfitting, and data quality issues which can bias results. Complex biological systems sometimes resist standard modeling approaches, and lack of standardization hampers cross-study comparisons. Additionally, substantial statistical expertise and computational resources are required, posing barriers for routine implementation.
Linear Model (PLA)
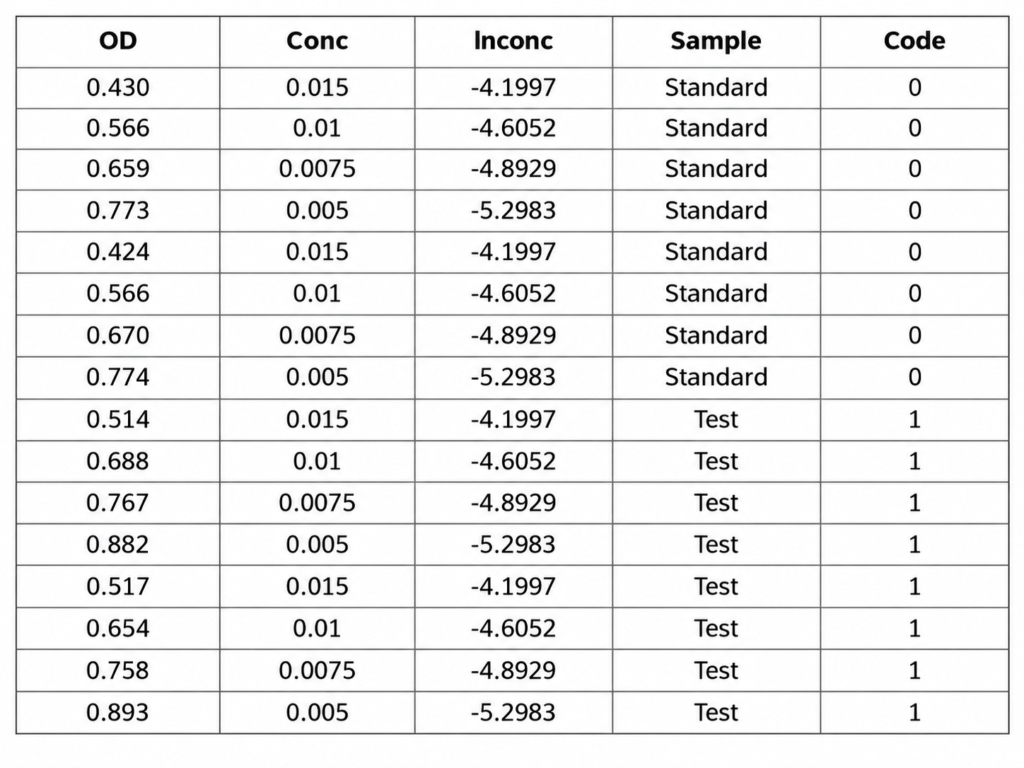
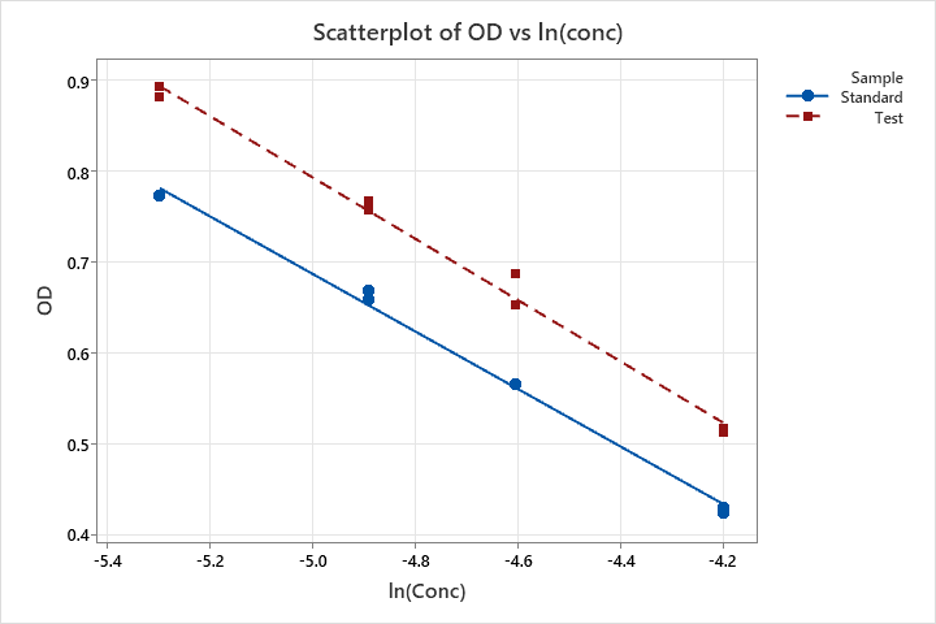
When the model is fit for the constrained model the common slope is -0.3276 and the difference in the intercepts is 0.1016. The relative potency is therefore 73.3%. It is interesting that the statistical test for similarity would show unequal slopes, though fitting a regression curve to just the standard yields a slope of -0.3171 and intercept of -0.8983 and the regression for the test sample yielded a slope of -0.3373 and intercept of -0.8927. A simple ratio of the slopes is 0.94 which if we set an acceptance criteria of ±10% would indicate similar slopes. The ratio if the slope from the unconstrained model is less sensitive to shifts in the intercepts from forcing a common slope.
Non-linear (4-PL)

Conclusions
- The new ratios give similar results to traditional results but are based on how the constrained model “moves” from the unconstrained standard.
- If the test curve was parallel to the standard curve which is required for similarity, the constrained parameters should not change significantly.
- There are still lots more simulation work to be done to determine acceptance criteria.
- Stay tuned!!!!!

About The Author: Steven Walfish
Mr. Walfish is Principal CMC Statistician at Iovance Therapeutics. In this role, he is responsible for support of process and analytical functions including qualification and validation of bioassay. Prior to Iovance, Mr. Walfish worked at AstraZeneca, GSK and United States Pharmacopeia (USP) where he was responsible for the Statistics Expert Committee. Prior to USP, Mr. Walfish was Principal Statistician at Becton Dickinson in Franklin Lakes, NJ responsible for supporting continuous improvement efforts and process development for worldwide operations. Mr. Walfish has held roles at GE Healthcare, Human Genome Sciences and Chiron. Steven was President of Statistical Outsourcing Services, a consulting company that provides statistical analysis and training to the FDA regulated industries.
Mr. Walfish brings over 30 years of industrial expertise in the development and application of statistical methods for solving complex business issues. Steven has experience applying statistical methods to analytical method verification and validation and stability analysis.
Mr. Walfish holds a Bachelors of Arts in Statistics from the University of Buffalo, Masters of Science in Statistics from Rutgers University and an Executive MBA from Boston University.